Cloudiness
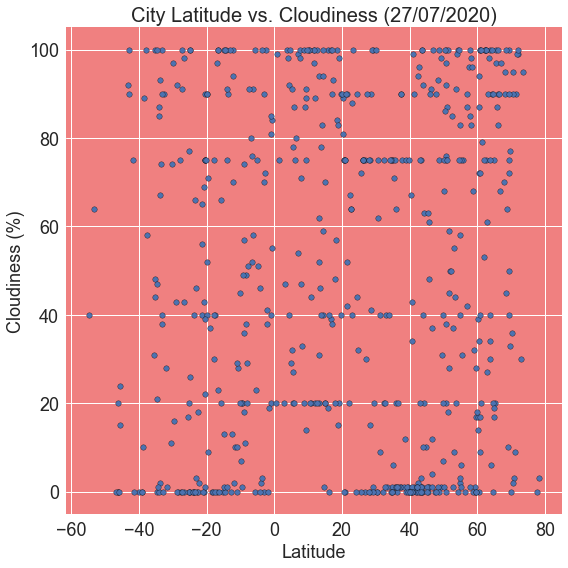
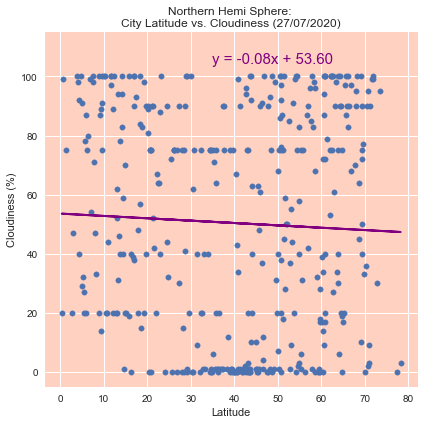
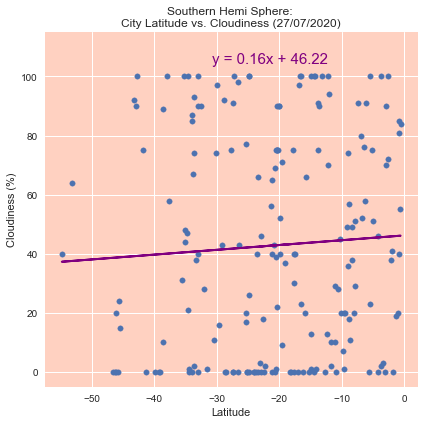
This plot illustrates the latitude versus the cloudiness percentage and we can observe no pattern here! The regression analysis on both the hemispheres leads to better understanding!
-
Cloudiness(%) doesn't correlate with the distance from the equator.
- Observe that p-value of the linear regression estimator > significance level (typically 0.05). This means that WE CANNOT say that slope is NOT zero.
- In both hemispheres, a weak correlation between latitude and cloudiness.
-
Cloudiness is centred around different values in both hemispheres.
- The northern hemisphere has average cloudiness around 54%.
- The southern hemisphere has average cloudiness around 46%.
Visualizations